Leveraging Observability Features of Keycloak
Keycloak is a critical component in many Identity and Access Management (IAM) deployments. Monitoring its health and performance is essential to ensure reliability, quickly diagnose issues, and proactively respond to anomalies.
Starting with Keycloak 26.2, observability has become significantly easier. Keycloak now provides built-in support for collecting logs, metrics, and distributed traces, making it straightforward to integrate with modern observability platforms such as Grafana, Prometheus, Loki, and Jaeger.
In production environments, multiple Keycloak instances typically run behind a load balancer for high availability. This raises an important question:
How do we collect logs, metrics, and traces from every Keycloak instance and visualize them through a unified dashboard?
This article demonstrates one approach using Grafana and the LGTM (Loki, Grafana, Tempo/Jaeger, Prometheus) ecosystem.
Prerequisites
This article covers the installation and configuration of the following components:
| Component | Purpose |
|---|---|
| Promtail | Collect Keycloak logs |
| Loki | Store and index logs |
| Prometheus | Collect metrics |
| Jaeger All-In-One | Collect distributed traces (development setup) |
| Grafana | Visualize logs, metrics, and traces |
In this article:
- Keycloak runs as a bare-metal installation on Windows.
- All monitoring components run as Docker containers.
- The same concepts apply to production deployments on AWS EC2, ECS, or Kubernetes (EKS).
Architecture Overview
                   +----------------------+
                   |      Grafana         |
                   +----------+-----------+
                              |
         +--------------------+--------------------+
         |                    |                    |
         |                    |                    |
    Prometheus             Loki               Jaeger
         ^                    ^                    ^
         |                    |                    |
         |                 Promtail                |
         +--------------------+--------------------+
                              |
                       Keycloak Server
Log Collection
Why Logs Matter
Logs provide detailed runtime information about Keycloak.
In environments where multiple Keycloak instances are running, centralizing logs makes troubleshooting significantly easier.
Create a Docker Network
docker network create monitoringRun Loki
docker run -d \
  --name loki \
  --network monitoring \
  -p 3100:3100 \
  grafana/loki:2.8.2
Configure Promtail
Create a file named promtail-config.yml.
server:
  http_listen_port: 9080
  grpc_listen_port: 0

positions:
  filename: /tmp/positions.yaml

clients:
  - url: http://loki:3100/loki/api/v1/push

scrape_configs:
  - job_name: keycloak-logs
    static_configs:
      - targets:
          - localhost
        labels:
          job: keycloak
          instance: instance_host_name
          __path__: /var/log/keycloak/*.log
Notice the label:
instance: instance_host_nameThis allows Grafana to filter logs by Keycloak instance, which becomes especially useful in clustered deployments.
Run Promtail
docker run -d \
  --name promtail \
  --network monitoring \
  -v C:\keycloak-26.2.5\data\log:/var/log/keycloak \
  -v C:\Projects\kc-metrics\promtail-config.yml:/etc/promtail/config.yml \
  grafana/promtail:2.8.2 \
  -config.file=/etc/promtail/config.yml
Run Grafana
Create a Docker Compose file.
services:
  grafana:
    image: grafana/grafana:latest
    container_name: grafana

    ports:
      - "3000:3000"

    networks:
      - monitoring

networks:
  monitoring:
    external: true
Start Grafana.
docker compose -f docker-compose-grafana.yml up -dAfter adding Loki as a data source, you can filter Keycloak logs using the instance label.
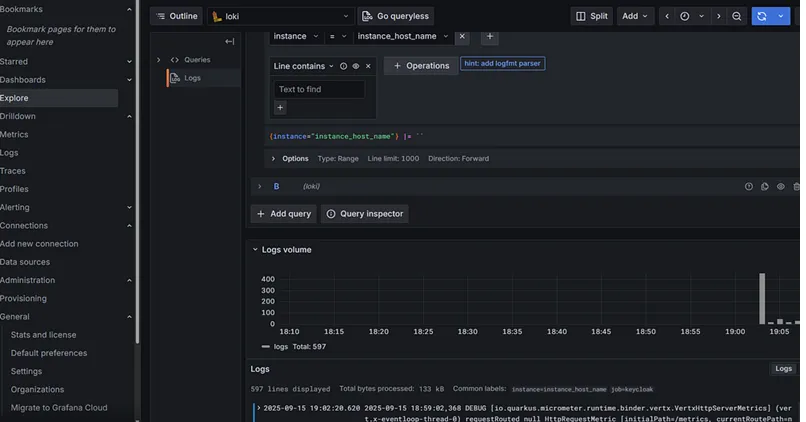
Screenshot: Grafana log view filtered by Keycloak instance.
Metrics Collection
Why Metrics Matter
Metrics provide quantitative information about Keycloak’s health and performance.
Examples include:
- HTTP request counts
- Login activity
- Token issuance
- Cache statistics
- Response times
Keycloak exposes metrics at:
http://localhost:9000/metricsPrometheus periodically scrapes this endpoint, and Grafana visualizes the collected metrics.
Enable Metrics in Keycloak
Start Keycloak with metrics enabled.
kc.bat start ^
  --metrics-enabled=true ^
  --event-metrics-user-enabled=true ^
  --event-metrics-user-tags="realm,clientId" ^
  --event-metrics-user-events="login,logout,refresh_token" ^
  --http-metrics-histograms-enabled=true ^
  --cache-metrics-histograms-enabled=true ^
  --http-metrics-slos=250
Security Note: Do not expose the metrics endpoint directly to the public Internet.
Configure Prometheus
Create prometheus.yml.
global:
  scrape_interval: 15s

scrape_configs:
  - job_name: keycloak

    static_configs:
      - targets:
          - host.docker.internal:9000
Since Keycloak is running directly on Windows while Prometheus runs inside Docker, host.docker.internal allows the container to access the host machine.
Run Prometheus
services:
  prometheus:
    image: prom/prometheus:latest

    container_name: prometheus

    ports:
      - "9090:9090"

    volumes:
      - ./prometheus.yml:/etc/prometheus/prometheus.yml

    networks:
      - monitoring

networks:
  monitoring:
    external: true
Start Prometheus.
docker compose -f docker-compose-prometheus.yml up -dImport Keycloak Dashboards
Clone the official Keycloak Grafana dashboards.
git clone -b main https://github.com/keycloak/keycloak-grafana-dashboard.gitImport a dashboard into Grafana:
- Open Dashboards → Import
- Select one of the dashboard JSON files.
- Choose Prometheus as the data source.
- Import the dashboard.
During testing, the keycloak-capacity-planning-dashboard worked well in a bare-metal setup.
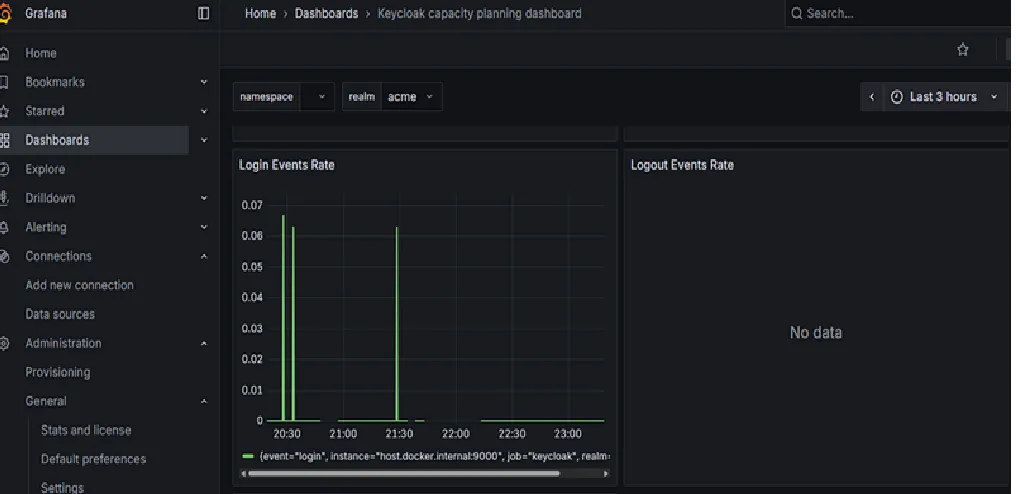
Screenshot: Keycloak Capacity Planning Dashboard.
Distributed Tracing
Why Tracing Matters
Logs explain what happened.
Metrics show how often it happens.
Tracing explains why it happened by following an individual request across multiple services.
Grafana also supports Exemplars, allowing metrics to link directly to traces.
Enable Tracing
Start Keycloak with tracing enabled.
kc.bat start --tracing-enabled=trueRun Jaeger
docker run \
  --name jaeger \
  --network monitoring \
  -p 16686:16686 \
  -p 4317:4317 \
  -p 4318:4318 \
  jaegertracing/all-in-one
The Jaeger UI becomes available at:
http://localhost:16686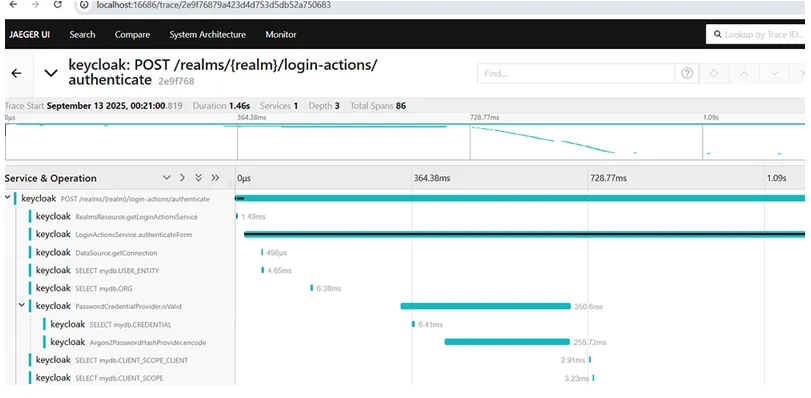
Screenshot: Jaeger Trace Explorer.
Configure Grafana
Add Jaeger as a Grafana data source.
http://jaeger:16686Use Grafana Explore to browse traces generated by Keycloak.
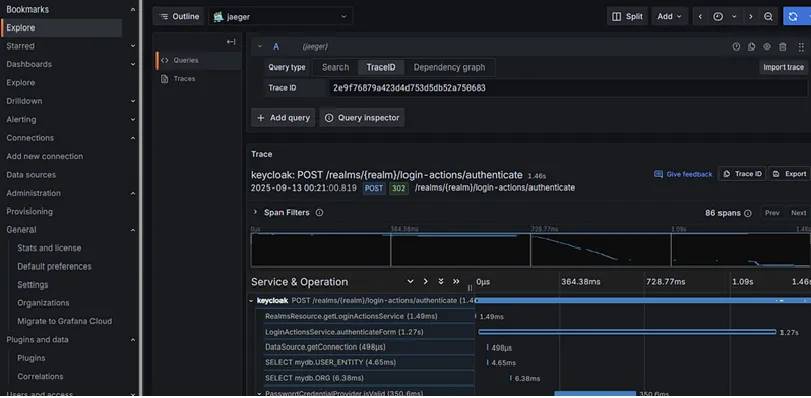
Screenshot: Viewing traces from Grafana Explore.
Production Considerations
For production deployments:
- Run multiple Keycloak instances behind a load balancer.
- Assign a unique instance label to each server.
- Secure all metrics endpoints.
- Configure retention policies for Loki, Prometheus, and Jaeger.
- Enable backups for observability data.
- Configure Grafana and Prometheus alerting to notify administrators of abnormal conditions.
Conclusion
Keycloak’s observability capabilities introduced in recent releases make monitoring significantly easier.
Using:
- Promtail for log collection
- Loki for centralized log storage
- Prometheus for metrics
- Jaeger for distributed tracing
- Grafana for visualization
you can build a comprehensive monitoring solution that provides complete visibility into your Keycloak deployment.
In production environments, correlating logs, metrics, and traces greatly simplifies troubleshooting and helps identify performance bottlenecks before they impact users.
Further Reading
- Keycloak Observability Guide
- Keycloak Metrics Guide
- Grafana Documentation
- Prometheus Documentation
- OpenTelemetry Documentation